Showing posts with label television advertising. Show all posts

Friday, September 15, 2017

Deceleration of TV Ad Sales

As television ad sales slow, terms such as “cord-cutters” and “cord-nevers” are being used more and more frequently. According to eMarketer, viewers are moving to alternative platforms quicker than expected.


The rise of subscription services allow users to access channels such as HBO and ESPN without ever having to pay for cable.  On top of this, digital platforms now offer live TV channels, including sports, and the amount of time viewers consume digital video has increased 9.3% this year.

In 2017, an estimated 196.3 million adults in the United States will watch pay TV. eMarketer predicts that by 2021, this number will drop 10 percent to 181.7 million.

Although television ad spending in the U.S. is up from 2016, the share of total media ad spend is decreasing.
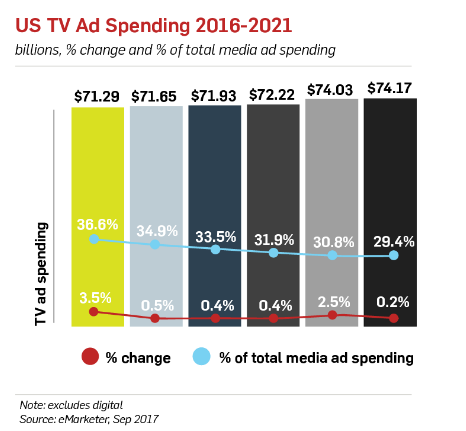

Many broadcast networks utilize digital platforms to reach delayed viewers. Despite this strategy, “the bulk of ad revenue continues to come from linear viewing”. 

Monday, July 24, 2017

Advertising Market Predictions Through 2021

Every year, Price Waterhouse releases their Entertainment & Media Outlook report with advertising market predictions through 2021.

Since last year’s report, online advertising has overtaken television by about $15 billion. By 2021, the online advertising market is estimated to be 50% larger than TV and has a compound annual growth rate (CAGR) of 9.9%.

Mobile has the largest share of online ad spend and accounts for 71% of all internet consumption, as reported by Digiday. Fueled by social video, “mobile advertising is projected to grow by an annual average of 18.7% from 2016 through 2021”.  

Television advertising spend is growing slowly and is expected to reach 38.8% share of the market in 2021. Its low CAGR of 1.3% is due in part to declining viewership, a trend driven by younger demographics. Marketing Charts reports that this decline is not only due to cord-cutting but also the fact that 18-24 year olds are watching less traditional television.


With both the magazine and radio markets remaining flat, the only market expected to see a decline in revenues by 2021 is newspaper advertising. Despite loyal readership, the newspaper market revenues are expected to drop by $4.6 billion between 2017 and 2021. 

Friday, June 2, 2017

Key Takeaways from the Internet Trends Report

From YouTube’s decreasing share of mobile traffic to the personalization of voice-activated devices, the newly released Internet Trends report offers unique insight into the digital advertising industry. Thanks to Adweek, marketers do not need to read through the 355-page report for the key takeaways.

1)    Dip in Smartphone Sales
In 2016, smartphones saw not only a decrease in sales but also in user-base growth. Globally 2.8 billion people own smartphones. While they remain extremely popular, the user-base only grew by 12 percent in 2016 compared to 25 percent in 2015.

2)    Increased Time Spent on Mobile
Adults spend an average of 5.6 hours per day consuming digital media. The majority of that time (3.1 hours) is spent on mobile devices while desktops account for 2.2 hours. The remaining 0.4 hours come from other devices.

3)    Internet vs. TV Ad Spend
The total Internet ad spend is growing faster than television ad spend, and 85 percent of Internet ad spend is through Google and Facebook. Compared to its 2015 ad revenue, Facebook experienced a 62 percent growth in 2016.

4)    Voice is the Next Frontier
Between the fourth quarter of 2016 and the first of 2017, Amazon’s voice-enabled assistant, Echo, gained 3 million users. With its increasing personalization, voice and visual recognition are considered to be the “next frontiers in search and discovery” by Photon’s VP of marketing, Michael Levine.

5)    Ad Blocking on the Rise

With about 640 million devices utilizing ad blockers in 2016, marketers have the right to remain wary of the software.

Monday, April 3, 2017

Digital Tops TV Despite Some Specific Struggles

Ad Age reports that US digital advertising sales surpassed television ad sales for the first time in 2016. Digital sales pulled in $70 billion compared to $67 billion on the more traditional television medium.

Magna, a strategic media forecasting company, reports that television saw a 4.7% increase in 2016 due to the Olympics and the presidential election. However, that growth is expected to settle back into the 3.7% range for 2017. Meanwhile, digital sales are projected to increase 14% in 2017. Magna believes that by the end of 2017 digital advertising sales will pass television in not only the United States, but globally.

With this, digital vendors are under the microscope more than ever before. Big brands like JP Morgan Chase are pulling the plug on their programmatic to avoid their ads being placed on unwanted sites.

Other large companies have had it with video hub, YouTube, as they are unhappy with the videos their ads are paired with. While advertisers understand that ads are placed with algorithms, formulas, and data, users are not quite as informed. Many users believe that the ad aligned with the video they are viewing is purposefully done.

YouTube isn’t taking a front row seat to their slow destruction though. The Google owned company is taking steps to allow advertisers to proactively avoid undesired content. Previously, YouTube had two preventative options to avoid, “sensitive social issues” and “tragedy and conflicts”. Now, YouTube has rolled out options to stay away from content that is, “sexually suggestive”, “sensational and shocking” and “profanity and rough language”.

While this may help advertisers, YouTube seems to be stuck between a rock and a hard place as they’re receiving push back from content creators. YouTube states in a blog post that, “There’s a difference between the free expression that lives on YouTube and the content that brands have told us they want to advertise against”. With this setback, YouTube could potentially lose $750 million this year.


Even with upset brands and algorithm tweaks, digital advertising has a bright future as king of the castle. 

Thursday, September 15, 2016

Unexpected DVR Trends

I remember when my family first got a DVR; I was a young teenager with two very frugal parents. However, when the cable company offered a free trial, my dad bit the lure and after a few months we were hooked.

Even as a kid, I remember hearing the buzz about how DVR would ruin the television industry and take away from the advertisers. Surprisingly enough, data from Nielsen and the Video Advertising Bureau report a different story.

During the first quarter of 2016, time-shifted programming (recording television and watching it at something other than the original air time) has dropped 12% among viewers 18 and older.

For years, estimates had been that viewership would be roughly 50/50 between time-shifted programming and live programming. However, data from first quarter 2016 shows that 77% of viewing is done live while only 23% comes from DVR viewing.
Other demographics have seen a decline in DVR viewing as well. Those aged 50-64 have dropped 6% while people 65+ have declined 7%.

So, why aren’t people watching as much prerecorded television shows as they used to? After all, it does give you the power to fast-forward through all those commercials. Perhaps the industry is simply shifting. One theory is that the rise of digital media is to blame.

In my mind, this is great for advertisers. Most digital streaming video has opportunity for advertisements without the ability to fast-forward.


Fear not! Viewers are still watching television and they’re still watching their DVRs. Advertisers can still reach their audience during shows; it just might be through their laptop or smartphone screen rather than on “the tube”. 

Monday, June 20, 2016

Broadcast or Digital? How About Both

President and CEO of Nexstar, Perry Stock declares, “Traditional TV remains the dominant reach medium with the greatest share of video viewership and superior engagement and influence on consumers’ purchasing and voting decisions. As our business continues to evolve with the changing new media landscape, we are focused on developing new technologies, products, and services that complement our broadcast and digital media platforms.”

Well, that’s exactly what Nexstar has done. Along with its subsidiary, Yashi, Nexstar has created a Digital Mirror platform that links video advertising on television with pre-roll on digital mediums.

Digital Mirror is a new technology that allows advertisers to take over the programmatic pre-roll inventory in a specific DMA during and immediately following a broadcast commercial. For example, you’re watching your favorite prime time show (for me, Blacklist takes the prize) when the show goes to a commercial break. There you see a commercial for the latest and greatest restaurant in your area. Well, commercials aren’t all that exciting so you switch to your smartphone/tablet/laptop. Next thing you know, there’s a pre-roll ad for that same awesome restaurant. Now, after seeing that sizzling steak for a second time, you mouth starts to water. Maybe you are hungry. Blacklist can wait, right? You push pause, strap on your shoes, grab your wallet, and head out the door.

Okay, so every advertising opportunity might not work out as seamlessly as above, but with Digital Mirror, advertisers can take over the pre-roll inventory for three minutes after the conclusion of their video. Advertisers can now reach their customers on multiple devices at nearly the same time. Not only will advertisers reach those who actually saw the television commercial, but they will also reach those not watching television with the pre-roll ad running throughout the DMA.

So far, Digital Mirror is available in three Nexstar markets with the platform expected to roll-out into all other markets within the year. The technology hosts a platform which allows full transparency and real time data so advertisers know where and when multi-screen impressions occur and the analytics that dig deeper. 

Friday, October 16, 2015

Online Video Catches Up with Television

According to a new report from Millward Brown, consumers are spending just as much time watching online video as they are watching television.

This might not come as a surprise to many advertisers, as we have seen growth in online video streaming, however, this shifts how advertisers can best reach their target audience.

Millward Brown conducted a global study of over 13,500 multiscreen viewers (people with a TV and either a smartphone or tablet) in 42 different countries. The study showed that people between the ages of 16 and 45 watch 204 minutes of video a day. 
Those 204 minutes are split equally between television viewing and online viewing.
This study has shown that not only younger generations utilize online video, but also Generation X-ers.

Consequently, viewers tend to find online advertisements irritating. Only 19 percent of online viewers responded in favor of online ads during their videos while 27 percent of viewers feel positively about television ads.

Interestingly enough, 41 percent of people who were included in the study responded favorably to ads tailored to their interest. With that being said, only 25 percent of respondents like ads that had tracked their browsing history and promoted something from a website they had previously visited.

With this information, advertisers can start pushing their video ads onto online platforms. The most important measure of this transition will be the content and context in which the advertisements are displayed to make sure it is received with a positive connotation.

Friday, July 17, 2015

Report on time spent viewing video among American adults

As consumers have more devices available to watch television content, the question remains how much traditional television is still viewed.  According to research from Nielsen, while video viewing on PCs, smartphones and tablets increase, traditional TVs still have the biggest usage numbers.

MediaPost reports the findings that American adults watch video content weekly on the following devices in these increments:
·        Television: 36 hours and 7 minutes per week
·        Video on a PC (Personal Computer): 1 hour and 30 minutes
·        Video on a smartphone: 13 minutes
·        Video on a tablet: 11 minutes

The reach of these screens with adults breaks down as follows:
·        Television: 87.2%
·        Video on a smartphone: 36.9%
·        Video on a PC: 36%
·        Video on a tablet: 17.5%


Overall, TV still has a large audience potential. Even with the use of DVRs, OnDemand, and streaming services, there is still a significant portion of the population utilizing television.

Thursday, March 19, 2015

How does a media buyer verify that a schedule actually ran?

As a media buyer, there is a lot of interaction between the media vendor and buyer; likewise, the media buyer interacts a lot with his/her client. Part of the job is following up with vendors to verify that the advertising placed actually did run. This is the backend paperwork that is necessary in order to avoid accounting errors and to keep clients updated. Below are a few questions that most media buyers/planners must address for each campaign and define expectations for the client.

How often should I receive online summary reports from my vendor? Some media experts say that monthly reports should be enough to watch online trends. While others, I fall into this category, prefer to see a report every two weeks. That way, if a negative trend is caught, it can hopefully be reversed prior to the end of the month. A buyer should speak to the vendor and client and agree upon a summary report schedule prior to running a campaign.

What should I expect for a proof of posting for an out-of-home campaign? For outdoor billboards, bus signs, train signs, and any signage out-of-home, a proof of posting should be sent to the media buyer. The proof of posting should be a time stamped photograph that verifies the location, panel number, date and time creative was installed. Historically, hard copy pictures were requested; however, nowadays, a .jpg photo is typically fine.

How many tearsheets should I request from the print vendor? Before a campaign starts to run, ask your client if they would like tearsheets of their upcoming ads. If not, request two copies, one for accounting and one for your files. If your client does want a copy, verify how many are needed and notify the vendor. eTearsheets are becoming more and more common place. These are a viable option; however, it is a good idea to let the client know that’s how the tearsheet will be sent.


What is the best way to verify that my spots ran on a broadcast schedule? When a cable, television, or radio schedule runs, a spot log is created. Basically, this is just a listing of each time an ad runs. The report should include the time, date, length, cost, and creative title. A buyer can request this at any time, but it’s typically evaluated when an invoice is submitted by a station.

Friday, February 13, 2015

Research ranks top favorite TV shows currently running

If you ask any group of people what TV show they like to watch the most, more than likely, you will get quite a few shows mentioned. Harris Poll recently surveyed a little over 2,000 American adults to see which television show earned the top spot.

MediaPost reports that after all responses were tallied, current favorite TV programs ranked as follows:
1.      “NCIS”: CBS-TV
2.      “Big Bang Theory”: CBS-TV
3.      “The Walking Dead”: AMC
4.      “Scandal”: ABC-TV
5.      “Game of Thrones”: HBO
6t.     “The Good Wife”: CBS-TV
6t.     “The Blacklist”: NBC-TV
8.      “Modern Family”: ABC-TV
9.      “Blue Bloods”: CBS-TV
10.    “Criminal Minds”: CBS-TV

Not surprising is the fact that the three top favorite current TV shows are also heavily re-run in syndication.


Also, the poll does relatively reflect standard Nielsen TV ratings. For example, “NCIS” had a reported 19.8 million average viewers during original episodes airing. So, the high Nielsen ratings are pretty much corroborated with the general TV viewing public.

Thursday, July 31, 2014

Television is still prime media choice for US' youth

With all of the hype surrounding new technology and how the younger generations adapt earlier, it can lead to the question, what happens to the older technology? The simple answer is it is still there. eMarketer recently reported on a few studies that researched how younger audiences still consume television in spite of other newer digital options.

While the exact amounts of television consumption across younger age ranges differ amongst the research studies, each come to relatively the same conclusion. That is, television is still the primary media consumed by children. One study by Nielsen found that kids, between the ages of 2 and 11, watched approximately 111 hours and 10 minutes per month of “traditional” TV. These kids also spent another 10 hours and 45 minutes watching timeshifted television. In regards to content viewed on a DVD or Blu-ray player, children watched about 9 hours and 18 minutes per month. Another report by Joan Ganz Cooney Center at Sesame Workshop put 8 to 10 year-olds as watching 1 hour and 24 minutes of TV per day. This information was according to the children’s parents.

With the introduction of streaming sites like Netflix, Hulu, YouTube, or Amazon, kids have more access to on-demand programming. While the adult counterparts have been accused of “binge viewing” TV and movie content, the term “déjà view” has become a moniker for younger audiences. This term describes the habits of repeatedly watching the same episode or movie many times. If you have kids, how many times have you seen Frozen?


Younger American audiences are watching TV. While researchers may argue the exact amounts, the fact remains that television consumption is still high with the younger audiences.

Thursday, May 1, 2014

TV platform where more ads are seen

If given the opportunity to watch television on Video-On-Demand, on a DVR, or live, on which method would you tend to watch more TV commercials? If you ask Nielsen, you will find that Video-On-Demand viewers tend to watch more commercials.

MediaPost reports that TV viewers who watch a 30 minute program actually see different amounts depending on the TV platform used.
·        Video-On-Demand: An average of 28 minutes of programming and commercials are viewed by the audience.
·        DVR: An average of 23 minutes is viewed.
·        Live TV: Only about 20 minutes of the program and commercials are viewed.

These averages are not surprising if you apply it to your own TV usage habits. If you watch live television, is it possible that you get up during commercial breaks to do something else? If you have a DVR, is it possible that you fast forward through the commercials or parts of the program you are not interested in watching? Or, do you ever rewind the DVR footage to watch a commercial that caught your attention? If you use Video-On-Demand, you may notice that the fast forward function is not enabled and commercials will run. However, the commercial break may not be as long as live TV.


At any rate, while there are multiple methods in which to watch TV, it still can be said that an audience can be exposed to commercials.

Monday, March 31, 2014

New study shows the ratio of viewer focus when in front of multiple screens

Be honest, do you ever watch television and work on a laptop, use your smartphone, or are on your tablet at the same time? Truthfully, you are not alone. eMarketer reported on a November 2013 survey conducted by TiVo. Good news for the television industry, even though there is competition with viewers’ eyes when they are multi-screening, viewers tend to focus the most on TV.

Results from the study: Devices operated simultaneously while watching television according to US TV viewers.

Smartphone:
-         24% “almost always” use the smartphone while watching TV
-         61% have “ever” used the smartphone while watching TV

Tablet:
-         19% “almost always”
-         37% “ever”

Laptop/netbook:
-         11% “almost always”
-         49% “ever”

Desktop computer:
-         6% “almost always”
-         18% “ever”

Portable game system:
-         1% “almost always”
-         6% “ever”


The study also showed that approximately 27% of surveyors used a second device to “search the internet for information” while watching television. The next highest ranking reason was to “use social media sites to read what people are saying” at 7%. Clearly, looking for information was the biggest reason.

Thursday, January 16, 2014

New study shows DVR saturation in marketplace is slowing down

Digital Video Recorders (DVRs) have been in the consumer marketplace for a few years now. As the device penetrated the market, researchers were watchful to track the rate at which it was adopted. New research conducted by Leichtman Research Group shows that the rate of saturation is slowing down.

According to MediaPost, results indicate that approximately 47% of all US TV homes have at least one DVR. By comparison, about 40% of households in 2010 had DVRs, and 23% of households in 2007 did. While there is still growth, the rate of it is not as vast as it once was.


Research shows that about 55% of homes subscribe to a multichannel TV service like cable, satellite or telco. Also, the majority of DVR owners received the device from their TV service. Of those surveyed, four percent did not have a TV service subscription; however, they did have DVRs.

Thursday, December 26, 2013

Top ten TV shows across social media

Since word-of-mouth is one of the most effective tools in promoting or dissuading really anything, an advertiser’s biggest challenge is to encourage and direct it. With the introduction of social media, word-of-mouth is more readily available and mainstream than simple water cooler talk. That’s why it’s helpful for advertisers to know what dominates the social media arena.

According to Nielsen SocialGuide, cable TV shows, between September and November 2013, accounted for five of the top ten shows on social media. The focus was on the average unique audience.

MediaPost listed out the top ten shows as follows:
·        “Breaking Bad” from AMC with 6.03 million average unique audience (Cable)
·        “The Walking Dead” from AMC with 4.89 million(Cable)
·        “American Horror Story: Coven” from FX with 2.93 million (Cable)
·        “Scandal” from ABC with 2.31 million (Broadcast)
·        “Dancing with the Stars” from ABC with 2.22 million (Broadcast)
·        “The Voice” from NBC with 2.13 million (Broadcast)
·        “Glee” from FOX with 2.05 million (Broadcast)
·        “The X Factor” from FOX with 1.8 million (Broadcast)
·        “Catfish: The TV Show” from MTV with 1.77 million (Cable)
·        “Awkward” from MTV with 1.47 million (Cable)


The takeaway is the ability to know your audience. If your target audience are adults 18-49, and research shows that they like “Breaking Bad,” have your team track how that show trends on all types of social media. The good, bad, and ugly comments, posts, tweets, etc. can help an advertiser get a better picture of what the consumer wants and doesn’t want. 

Thursday, November 21, 2013

Does high TV viewership automatically mean a favorite show?

Have you ever began watching a new TV show, start to really enjoy it only to have it cancelled due to low ratings? Well, it’s safe to assume that has happened at least once in your lifetime. If it hasn't, consider yourself lucky. A new “sentiment” survey conducted by the media buying and selling software Strata attempted to find a correlation between TV viewership and emotionally positive ratings. Results showed that high viewership does not always mean a high positive response from viewers.

MediaPost reports that the CBS show “The Millers” had about 13.3 million Nielsen viewers for the premiere episode. However, the Strata poll showed that only 3% of those surveyed listed “The Millers” as a favorite new show. In contrast, the NBC program “The Blacklist” had similar viewership with 12.6 million, but it pulled a 15% mark for favorite new TV show.

The study also reveals that some shows have lower viewership numbers but a high positive score. “The Michael J. Fox Show” was like this with an 11% positive score and 7.5 million viewers.

Overall, the “sentiment” survey had CBS and NBC tied for best new programming with ABC in third, FOX in fourth, and AMC in fifth.

What can advertisers glean from this? A favorite show of a viewer, whether a high ratings program or not, can help cultivate a positive relationship with your brand. If the show has a long run, place your ads in it. If the show is cancelled, and you have the budget, why not hire the actors to reprise their roles in your commercials? If it makes sense for your brand and your audience, it can be a strong media relationship.

Thursday, August 29, 2013

Nielsen uses a new definition of TV homes to generate the Universe Estimate

Prior to the television industry’s 2013/14 season upfronts, the Nielsen Company typically releases its new TV home estimate. This allows advertisers to better estimate audiences.

According to MediaPost, the overall American TV household Universe Estimate grew from 2012. Last year, it was estimated that there were 114.2 million TV homes. This year, the estimate has grown by 1.2% to 115.6 million. In fact, there are about 1.6% more TV viewers from last year, which calculates into 294 million viewers who are 2 years old+. 

One reason given for this growth could be the new Nielsen definition of a TV home. Now, each home must have at least one working TV or monitor that can deliver content by means of antennae, cable set-top-box or a satellite receiver. The satellite receiver could include a broadband connection.


With the new TV home definition in use, it will be interesting to see how the TV home population develops over the next few television seasons.

Thursday, August 15, 2013

Research done to show if TV affects tweets or if the reverse is true

It’s not a new discovery in the media world that people can utilize multiple screens at the same time. What research hasn’t established is the concept of one media screen driving the other’s viewership up and vice versa. According to AdvertisingAge, the Nielsen Company and Twitter are working together to discover the correlation between live TV ratings and tweets.

Using SocialGuide, which derives from Nielsen and McKinsey & Co, over 221 primetime broadcast programs were monitored for the TV ratings and tweets. The study found that higher TV ratings often lead to more tweets of the particular show. Results showed a 48% increase in tweets when a live TV program grew in ratings. Likewise, as the number of tweets grew, it increased the live TV ratings in about 29% of the studied episodes.

Reports warn that this outcome may not occur with every program. A few examples of extremely hyped TV shows on Twitter that did not respond with high ratings were Oprah’s interview with Lance Armstrong and SyFy’s first viewing of “Sharknado.”


Overall, it makes sense. If you are browsing Twitter while watching something on TV and see a lot of chatter about a different program, it wouldn’t take much effort to change the channel. Similarly, if a particular show is so great for a variety of reasons, and you just need to share the wealth with everyone else, you may tweet about it.

Thursday, July 25, 2013

Television dominates user viewership on subscription video-on-demand services

For those of you out there that subscribe to a video-on-demand (SVOD) service like Hulu Plus, Amazon Prime or Netflix, would you be surprised to find that television content dominated consumer viewing over movies? The company GfK recently did some research to see which consumers prefer.

According to MediaPost, the three services have the following viewership:

·        Amazon Prime: 79% view TV content vs. 21% view movie content

·        Hulu: 96% view TV content vs. 4% view movie content

·        Netflix: 77% view TV content vs. 23% view movie content

Research shows that on average of SVOD services, television had about 81% viewership vs. movies at 19%.

Interesting to note is that a large amount of viewing takes place on an Internet-connected TV device. A device could be a gaming console, Blu-ray player, etc.


The important take away from this for advertisers is the fact that consumers are seeking out TV content on a massive scale whether it’s on broadcast television or a subscription service. Advertisers may not be able to be on some of the SVOD’s yet; however, there are still ways to reach these people through digital initiatives and maintaining a strong broadcast schedule. 

Thursday, June 6, 2013

Big cable network goes dark in order to promote radio

If you were planning to watch Comedy Central on Sunday, May 19th, what you found was probably not what you expected. In a marketing blitz, the cable network went dark for the entire day in order to promote the new Comedy Central SiriusXM station with a sample of the content. The new radio station was set to launch at midnight the following Monday.

According to MediaPost, the only other time Comedy Central had gone dark before was in 1992 for Johnny Carson’s final “Tonight Show” broadcast.

The satellite station will include some of the network’s stand-up comedy specials, original content, etc.


Cross-promotion among different media platforms is nothing new; however, if done in a smart way, it can be very helpful to a campaign. Time will only tell if the blitz and good programming will keep the new Comedy Central radio station relevant and solid in listenership.